In my last post, you met a nifty company named Black Stone Minerals (BSM). On face, it’s an attractive organization. To recap, BSM owns millions of acres of mineral rights in the United States. When oil and gas companies drill on those acres, they must pay BSM a portion of their revenues. In effect, BSM lets others do the hard work of extracting resources while it twiddles its thumbs and receives checks in the mail. Warren Buffett might comment this is the type of business “a ham sandwich” could run. This is not to minimize the thumb-twiddling. In 2022, BSM twiddled its way to $663 million in revenue.
BSM is a good business, but it takes work to determine whether it’s a good investment. Fortunately, I think I’ve done some of the work. As I write this, BSM trades at $17.13. I believe it’s overvalued. The “true value”1 of BSM is approximately $13.51 a share, according to a crude discounted earnings model I built. It’s not pretty, but I believe the model ballparks BSM’s valuation reasonably well. Well enough, in fact, to lead me to dump my shares and purchase BSM puts.
In the rest of this post, I’ll walk through the model and explain the assumptions made within it. I’ll begin with a basic overview of how the model works. Then, I’ll discuss my assumptions around the forecast period and discount rate, among other things. The majority of this post will then cover oil and natural gas production and price forecasts. In the end, I share how I estimated BSM’s margins and what would make this analysis better.
I wrote this to learn, so I welcome feedback. I also have thick skin. Send any comments to rileywilson1@protonmail.com
Model structure
In order to discount future earnings to the present, we need to model future earnings. I do this naively. First, I forecast future growth in oil and gas production by year for BSM. Then, I multiply those yearly figures with the respective forecasted prices for oil and gas to get estimated revenue.2 The final step is to multiply estimated revenue by an assumed margin to get the earnings. Formally, my estimate for the earnings in year $i$ is:

If the hats and subscripts put you off, don’t worry. They’re meant more for me than you. I encourage you to play with the model yourself for a clearer view of my methodology. Here’s the Excel file.
Once I have earnings, it’s straightforward to discount them to the present.
Modeling choices
In modeling BSM, I made decisions not everyone will agree with. Most of these were born from convenience. For instance, I discounted future earnings instead of future cash flows since I don’t fully understand cash flows. I also decided, arbitrarily, to model BSM out 10 years into the future. Call the 10 year period 2024-2034 the “forecasting period.” After the end of the forecasting period, I also assumed BSM operated for another 20 years while shrinking earnings 1% a year. I could have used the “terminal value” approach, but I decided not to. It sounds intellectually suspect that, in valuing a company today, you must first eyeball its value n years from now.
The most consequential decision I made concerns the discount rate. I chose 12%. There are sophisticated ways to choose the rate based on risk-free rates of return, equity risk premiums, market risk premiums, betas, and the characteristics of specific companies. I don’t fully understand these things yet, so I didn’t incorporate them. Instead, I read reasonable discount rates fall within the range of 12-20%, so I picked 12% to be conservative. This rate is likely too low given how volatile oil and gas prices are, but I’m comfortable with it. My hunch going into this exercise was BSM is overvalued. I’d rather give the company the best possible chance of being correctly or under-valued than choose figures that flatter my biases.
BSM oil production and prices
Context is helpful to forecast BSM oil production figures. The United States enjoyed a boom in oil and gas production from 2009-2019. New techniques like horizontal drilling and hydraulic fracturing allowed us to extract previously inaccessible oil in areas like the Bakken/Three Forks region in the Dakotas and the Permian Basin in Texas. Domestic production consequently ballooned in what is sometimes called the “shale revolution.”
![[US_oil_prod 1.png]] In this time period, the US went from the distant third largest oil producer in the world (behind Saudi Arabia and Russia) to the first. We produced so much oil, in fact, there were geopolitical consequences. Emboldened by domestic energy sources, the FT reports Washington could “take on oil-rich rivals in Iran and Venezuela without fear of economic blowback for voters at home” due to rising gas prices.3 At the time, OPEC had curtailed production in an effort to raise prices. The same FT articles quotes a US oil executive who says “we actually lowered the price [of oil] by $20 or $30 per barrel over the past 10 years.”
There were domestic consequences as well. I’m not the first to describe this, but the shale revolution followed a common pattern. A new technology is introduced and firms rush to exploit it. They convince investors to write big checks in pursuit of growth over short-term economics. There’s a drawdown, companies fail, investors lose money, and the remaining firms discover a commitment to fiscal responsibility. The shale oil industry is currently in the last phase. Investors have convinced oil companies to spend less on new wells and more on dividends. The industry is “underinvested” now and has no plans to increase production substantially. From 2009-2019, domestic oil production grew by nearly 10% annually. Now, companies are targeting growth between 0-5%.
The financial obstacles are compounded by those on the ground. Shale oil wells live fast and die young. After its first year of production, a well’s output may fall by 50%. After the second year, production may decline by an additional 30%. in 2019, 70% of US shale oil was produced by wells born in that year or 2018. Shale’s lack of endurance, coupled with underinvestment from the oil industry, does not bode well for US production. Output at existing wells will decline and there is little financial appetite to build new ones. In the short term, labour shortages and rising material costs are also bumping up the cost of new wells.
To convert the above information into a forecast, I treated the pre-COVID US domestic production growth rate as an upper bound. By my calculations, from 2009-2019, YoY production grew at ~10%. Future growth will be much less. The International Energy Agency published its 5-year oil production forecast earlier this year. Its numbers are not kind to US oil production. It estimates, due to the factors discussed above, domestic production will increase by ~8% in 2023, and then by less than 4% every year thereafter.
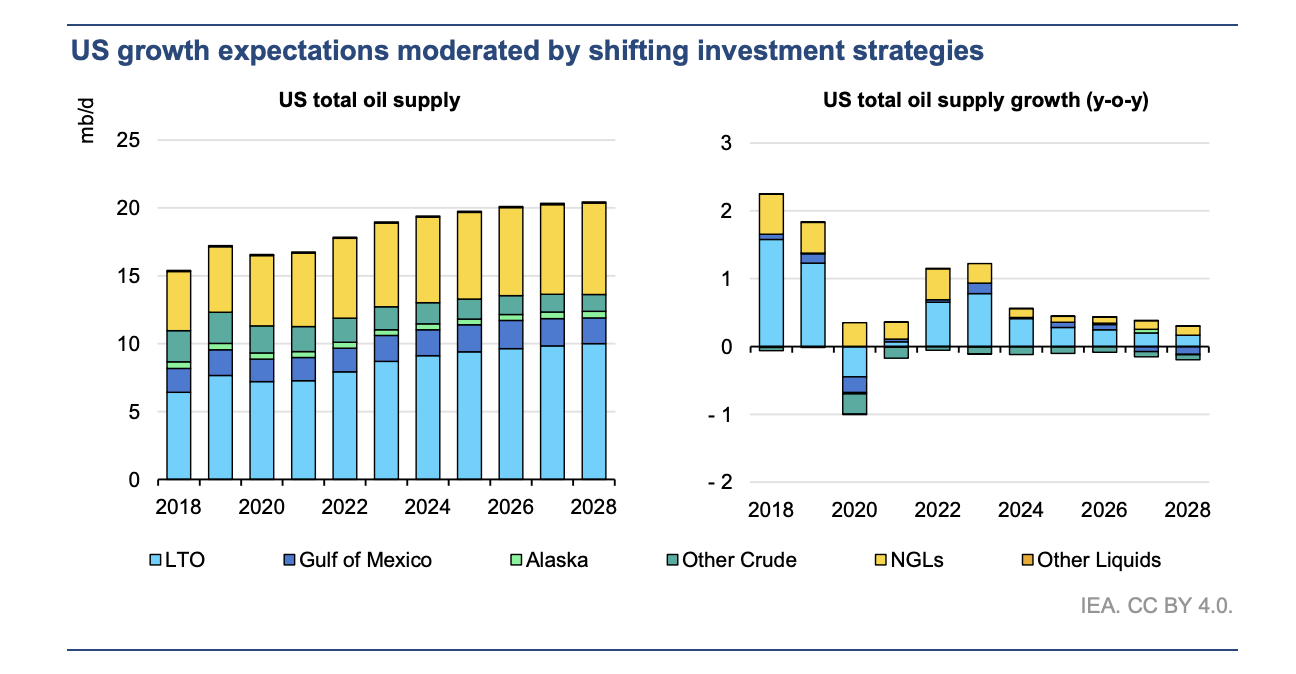
(Note the yellow components are natural gas liquids, not oil)
The IEA’s numbers pass the gut check. They are much lower than the 10% upper bound and accord with our notions about slow production growth. For that reason, I used them to model BSM’s oil production growth during the forecasting period. I don’t have exact yearly growth figures from the IEA, but we can eyeball them from the graph. My eyeball says the IEA is forecasting an approximately 7.6% increase in oil production from 2023-2024, and an ~3.5% increase every year thereafter until 2028.4 For simplicity, I assumed production increases at 3.5% from 2024-2025 to the end of the forecast period.
My analysis of oil prices relies on similar facts as the discussion on production. US oil production will slow as wells deplete and firms hesitate to build new ones. OPEC will be in a strong position to set prices, as it was prior to the shale revolution, so its influence will dominate. The price of oil will likely be closer to whatever OPEC prefers. If the oil executive quoted earlier was correct in that US production reduced the price of oil by up to $30, the OPEC equilibrium price may be well upwards of $80 a barrel. Saudi Arabia is making noise about production cuts even as the price of crude kisses $85.
I am not an OPEC watcher and making detailed oil price forecasts is beyond the scope of this investigation. As I mentioned in Part I, if I had strong convictions on the price of oil, I’d be an energy trader. For my model, I assumed oil averages $100 over the course of the forecast period. I wish I could provide a more rigorous analysis here, but I don’t have the intellectual tools to do so.
Natural gas production and prices
The same historical context about the shale revolution is useful in thinking about US natural gas production and prices. Domestic gas production rose substantially when horizontal drilling and hydraulic fracturing also made it feasible to extract gas from shale. In fact, much of US natural gas production is so-called “associated” or “wet” gas which rises to the surface in tandem with oil. In 2022, associated natural gas comprised 15% of natural gas supply. The majority of gas extracted in the Permian basin, which the EIA expects to drive near-term growth in domestic production, is also associated. If oil rigs stop drilling for reasons related to oil economics, then the flow of gas tempers as well.
As a result, our analysis of gas production will mirror that of oil. The rate of natural gas production growth from 2009-2019 can be an upper bound on future rates. By my calculations with publicly available data, it’s 5.3%. A reasonable lower bound might be 0%. Even during COVID natural gas production fell by less than a percent. Rapid decarbonization (which I am not optimistic about) or a global disaster are the only things which could bring consistent negative growth in the forecast period. The EIA expects natural gas production to remain steady in the near future. If it’s true energy companies have underinvested in new wells, domestic production may stagnate or grow modestly, in line with near-term forecasted performance.
In fact, the EIA gives some long-term forecasts in its Annual Energy Outlook. In its “reference case,” which assumes current laws and regulations and “evolutionary technological growth,”5 it forecasts natural gas production increases by 15% from 2022 to 2050 (page 27). This is not 15% annually. Rather, it’s ~.5% annual growth. If we assume all the growth happens during our forecast period (from 2024 to 2034) then the rate doubles to ~1%.
If you’re like me, this sounds surprising. You’ve heard the world has an insatiable desire for natural gas. Developing countries are ditching coal for natural gas power plants. Russian gas is politically untouchable, so the demand for American gas has increased. The EIA attenuates our surprise by noting American consumption of natural gas will fall over the coming decade. We will, according to their forecast, export more gas abroad while demand softens at home.
Forecasting natural gas prices is difficult. Again, if I had strong convictions here, I’d be a trader. The best I can say is the American price of gas will likely get closer to the European price. In other words, the domestic price of natural gas will rise. The current US gas price is ~$2.60 while the European one is ~$9.50. Those bullish on BSM envision domestic producers getting something like the European price for their gas.
I am somewhat less optimistic. European natural gas prices have always been higher than American ones. Since the shale revolution started in 2009, the gap between the two prices has been high as $10. Why hasn’t the US price risen to match the European price in the past? Surely 10 years is enough to build sufficient export facilities. (It takes four years to build an LNG export station from scratch). Even when the prices have converged, it is (with the exception of late 2010) the European price coming down to meet the American price, rather than vice-versa. I’m unsure of the exact dynamics here, but I’m willing to take history as my guide.
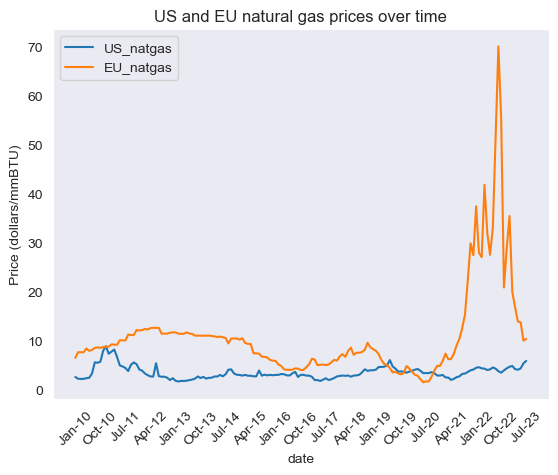
(source: EIA and Federal Reserve data)
I also have geopolitical reasons why Europe might not be hungry for American gas in the long term. The EU has imposed import restrictions such that member countries cannot purchase seaborne Russian oil. There are exceptions for landlocked countries importing via pipeline (like Austria and Hungary), though a price cap of $60 per barrel of crude is still imposed. However, there are no such restrictions for Russian gas. From my understanding, European states could import Russian natural gas tomorrow if Putin turned up the taps. The only reason the EU is experiencing a gas shortage is because Russia cut off the supply to protest sanctions at the start of the war. In fact, as of last March, some Russian gas was still flowing through Ukraine to the EU.
There is nothing preventing Russia from returning as a major supplier to the European market. Although the Nord Stream explosions have reduced export capacity to Europe, Russia has other pipelines like Turkstream, Yamal, and the Ukrainian transit. It may be politically unpalatable in the short term for Europeans to consume the gas, but the addition of price caps and time could change things. As a result, I think it’s incorrect to see Russian gas as permanently off the market. I am no expert on the situation in Ukraine, but the most likely scenario is the war ends and Russia is slowly reintegrated as a supplier over the course of the forecast period. In the long term, America may face Russian competition again for its exports.
As always, translating our discussion into a price estimate is supremely difficult. If we take gas futures contracts at their word, prices will rise until peaking during January ‘25 at $4.50 and then hover around the $3.50-4.50 range thereafter. This is very likely wrong, but I’ll take it as a base case. It’s consistent with the domestic price of natural gas moving above historical averages due to international demand. However it doesn’t reflect the — I believe — unlikely scenario where the price rises to converge with the European market and reaches $7 or above.
In my model, I therefore set the price of natural gas at $4 for 2024 and $4.50 for every year thereafter.[^2023]
Margins
We have growth rates and prices in our pockets. From here, we can multiply estimated production by estimated prices to get estimated revenue. What’s left is to reckon how much of that revenue remains as earnings. My methodology here is straightforward. I calculated BSM’s net margin since it went public and then eyeballed a plausible figure.6

45% sounds plausible. That’s around what BSM’s margin was through 2017-2019, pre-COVID and pre-war. The lower margins experienced from 2013-2016 were due in part to low commodity prices and so-called “impairments.” An impairment loss occurs when the carrying value of an asset is above its recoverable amount. A recoverable amount can be what the asset would sell for, or its future cash flows. In BSM’s case, it took massive impairment losses from 2013-2016 and very few since. I do not know the reason, but I’d suspect recently acquired assets have high carrying costs since depreciation hasn’t had time to bring them down, so fluctuations in the recoverable amount can be easily trigger impairment losses. The recoverable amount of oil and gas wells is influenced by oil and gas prices, which were quite low during 2015-2016. (I admit, this theory doesn’t explain the losses during 2013-2014 when prices were relatively high. I welcome feedback on this point).
If impairment is influenced by commodity prices as I envision, then higher oil and gas prices coupled with long-owned assets with lower carrying values would render BSM less susceptible future impairment charges. 2017-2019 rather than the period before seems to be more representative of BSM’s future margins as a result.
Discussion
Here is a table of the estimates/forecasts described above for the period 2024-2034
| Name | Value |
|---|---|
| Discount rate | 12% |
| BSM annual oil production growth rate | 8% from 2023-2024, 3.5% thereafter |
| Oil price | $100 a barrel |
| BSM annual natural gas production growth rate | 3% |
| Natural gas price | $4 per MMBtu in 2024, $4.50 thereafter |
| BSM net margin | 45% |
Plugging these into my model, I conclude BSM is worth ~$2.8b, or $13.51 a share. Again, I recommend you play with it yourself.
I’m not going to conduct a full sensitivity analysis. However, I do think it’s instructive to consider what would need to be true to justify BSM’s current value of $3.5b. The table below tells us what that variable would need to be over the forecast period, holding all others constant, for BSM to reach $17.11 a share in present value. For instance, the “discount rate” entry being 8% means, given all the other variables stay the same, we’d need to discount BSM’s future earnings by 8% to achieve an ~$17 share price.
| Name | Value |
|---|---|
| Discount rate | 8% |
| BSM annual oil production growth rate | 12% |
| Oil price | $148 a barrel |
| BSM annual natural gas production growth rate | 11.5% |
| Natural gas price | $8 per MMBtu |
| BSM net margin | 62% |
I’ve convinced myself BSM is overvalued. As a result, I sold all my shares and purchased puts. I am not betting the farm on BSM, though. There are, and forever will be, additional things I can do to increase my confidence in my conclusion. For one, I can learn more about OPEC, oil, natural gas, and commodity prices. I could also dive deeper into BSM’s financial statements and model out the production capacity and growth prospects of their specific properties. I should also interview industry experts and test my assumptions against their knowledge. There is also opportunity in bringing more principle to my discount rate calculation, or conducting a real sensitivity analysis. I also completely ignored the fact BSM pays a dividend. Unfortunately, I am a novice with finite time. I’m content, for now, with my crude analysis. It’s enough for me to shift around my portfolio, but I will not become wealthy, or go broke, from purchasing puts or selling BSM.
-
Whatever that means ↩︎
-
I also add a small figure to account for non oil and gas revenue. I include this in the formal expression of calculating earnings as “non oil/gas revenue” ↩︎
-
I draw on this FT article for much of this section. There are holes, but it’s one of the best articles I’ve seen on the post-COVID consequences of the US shale revolution. ↩︎
-
Here I’ll add the calculations I made to arrive at these figures. ↩︎
-
I take this to means something like “modest” or “average.” The reference case is meant to be a baseline against which the EIA compares other scenarios. I’m assuming the reference case is a reasonable first approximation to how the future could go, energy-wise. ↩︎
-
I said “straightforward,” not “rigorous”! ↩︎