Many people I’ve talked to in their early 20s aren’t having a good time. Some are mid-leap from school to industry, or stuck in menial white-collar work. Others are in a strange limbo between undergrad and their graduate school ambitions. The next group is fine career-wise, but struggling with an ennui that pulls them towards David Graeber, Yuval Noah Harari, and inchoate dreams of a hunter-gatherer lifestyle. Of course, there are exceptions, though not enough.
A friend and I pondered this observation. Peoples’ 20s are fraught with loneliness, career shifts, and general despair. If you’ll experience these things almost regardless of what you do, what decisions should you make differently? Everyone has heard stories of the miserable grad student or entry-level employee in a “passion” industry like entertainment or non-profits. We all agree they’re having a bad time.1 Yet, what’s unclear is how much worse a time they’re having compared to peers in a different position. If everyone is hedonically on the same footing, then otherwise painful life choices suddenly look better by comparison, especially if they set you up for likely satisfaction in the coming decades.
Or so my friend and I speculated. In the absence of data, we settled with conjecture. To verify if people in their 20s are, in fact, having a bad time, we’d have to talk to hundreds of them and then ask them odd questions about their life-satisfaction. For good measure, we’d also want to talk to 30-somethings and 40-somethings who ran the gauntlet in their 20s and see how they’re doing.
Enter the Astral Codex X public dataset
Astral Codex Ten (often stylized ACX) is an internet blog written by psychiatrist Scott Alexander. It’s difficult to summarize, but he covers almost everything. Some recent favorites are on aesthetic norms, San Francisco, cryptocurrency, pyschopharmacology as it related to current events, and Bay Area house parties.
Scott Alexander also runs a massive survey. Late last year, thousands of ACX readers submitted data on their profession, religious views, mental health, political stances, life satisfaction, standardized test scores, and other properties into an unassuming google form. I was one of them, and contributed to the 7,341 entries you can find summary statistics of, here.
You can probably see where this is going. The dataset gives us access to the self-reported life-satisfaction scores of thousands of 20-somethings, and thousands more people in their 30s, 40s, 50s, all the way up to their 70s. Now, with work, we can verify whether people in their 20s are, indeed, having a bad time.
Caveats on the dataset
Publications tend to cultivate a certain sort of audience. The average Vogue or American Rifleman reader differs from the general population in important ways. ACX is no exception. Fans of Scott Alexander have a profile familiar to anyone who’s watched Silion Valley. 87.6% of survey respondents were white, and 87.8% were male. To hit the trifecta, 82.6% of them are also straight 2. In addition, the plurality of respondents (33%) work in IT, and 86.1% have started a bachelor’s degree or other form of higher education. Fully 14.6% of respondents — representing more than 1,000 people — have a PhD, many in technical fields.
You cannot generalize with confidence from this dataset to the greater American population. Still, I think the data is useful for me. For one, even if we can’t make rock-solid inferences from this population to others, what we learn about it could influence our beliefs. If we discover a disturbing trend in ACX respondents, for instance, we may up our credence it’s more prevalent in the general population. Second, I’m looking to this data to help me make life decisions. The more the respondents are “like me,” the more justified I am in making tentatives inferences about how my life could shape out based on the data. For better or worse, I am a demographically modal ACX reader: a (half) white straight male from a first world country who enjoyed his college math courses.
On a more technical note, the following analysis does not, strictly speaking, use the dataset Scott Alexander posted. I dowloaded the CSV file and cleaned it up for my own purposes. This included removing empty values and changing the column headers so I could refer to them better.
Lastly, I’m not the first person to analyze this dataset. Other people with more statistical expertise than me have gone through it. I may have rehashed things covered elsewhere, but I don’t care.
Various measures of satisfaction among ACX readers
Each survey respondent was asked to assess themselves on five different measures of subjective wellbeing. 3 The measures, and the corresponding questions on the survey, are as follows:
- Life satisfaction
- Overall, how satisfied are you with your life?
- Job satisfaction
- How happy are you with your job?
- Social satisfaction
- How happy are you with your social life?
- Romantic satisfaction
- How happy are you with your romantic situation?
- Mood scale
- How would you rate your usual mood?
Responses were on a 10-point scale, with lower scores worse and higher scores better. There are legitimate questions about what some of the key words in these questions mean. How does one determine how satisfied they are with their life? Does happiness really capture all the complex feelings we have towards our jobs, social lives, or romantic situations? What, fundamentally, is a mood? I don’t have good answers to these now. I am also out of touch with the psychological literature that has tried to deal with them. Let’s assume the questions provide an adequate sense of our attitudes toward different aspects of our lives.
To get a sense of how measures of satisfaction change with age, I plotted the average of each of the five scores for different age brackets. The age divisions were chosen by Scott in an effort to anonymize the data.
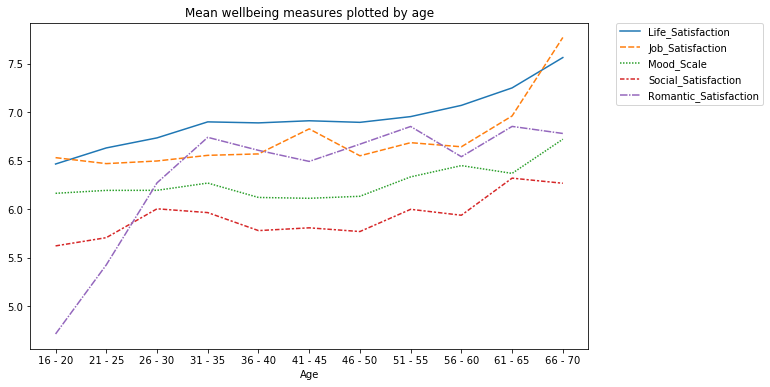
All measures in each age bracket have more than 100 observations, except for the Job_Satisfaction measure among 66-70 year-olds. That has 95 observations.
Several things stand out. First, it’s possible to observe dips in several well-being measures (romantic satisfaction, mood, social satisfaction) between the 31-35 to 51-55 range. This, I believe, is broadly consistent with the “u-shaped” curve researchers have found other metrics of life satisfaction to take. Second, there’s a little bump in job satisfaction that looks ‘related’ to the corresponding dip in romantic satisfaction. It’s possible to create little mental vignettes of a middle-aged person retreating into work because their love life is bad, or their love life being bad because they spend too much time at work.
Third, and most important to our project, are the 20-somethings. In two respects — life and romantic satisfaction — they average a worse time than their older counterparts. However, in terms of their average social lives and mood, they’re doing well. So well, in fact, they’re comparable with people on the other side of the valley of middle-age. In other words, they’re about to fall off a local maximum which will only be surpassed in 25 years.
Does this mean 20-somethings are having a bad time, relative to their older peers? With confidence, I can say they are, on average, romantically unsatisfied and report less life-satisfaction. The other measures, as mentioned, are less definitive. I will venture to say this suggests 20-somethings as a group are dissatisfied with life in general, insofar as they are romantically challenged, though this doesn’t account for individual cases. I suggested in the introduction many of my friends are dissatisfied professionally. The data suggest, however, they are not average.
Differences in satisfaction by education
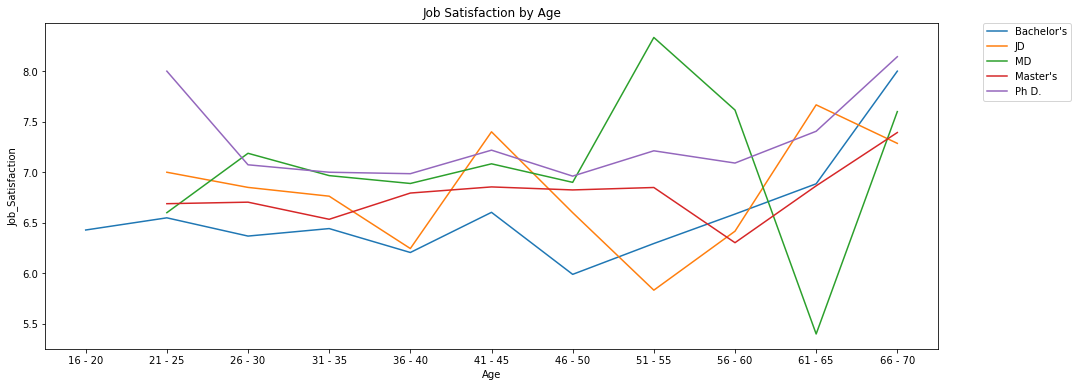
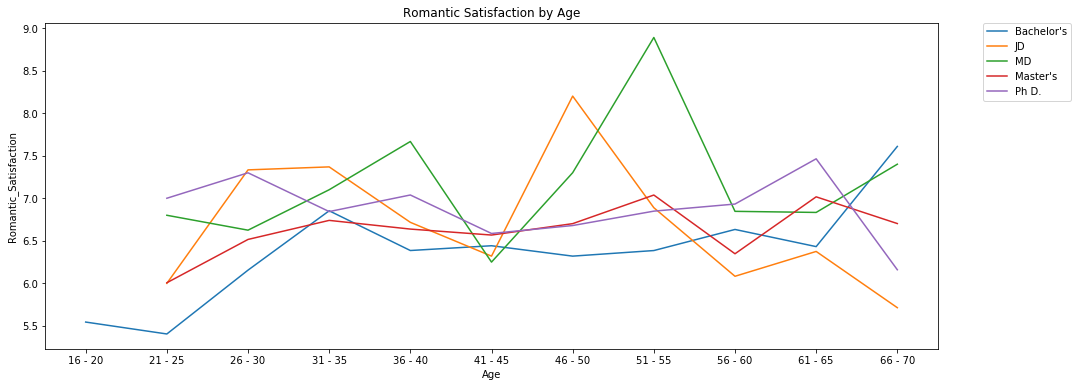
How do things look if we split the averages by education level? Are fresh PhD’s especially unhappy in their 20s? What about doctors going through residency? Are those with only a bachelors more satisfied, insofar as they’re carrying around less debt? Let’s see.
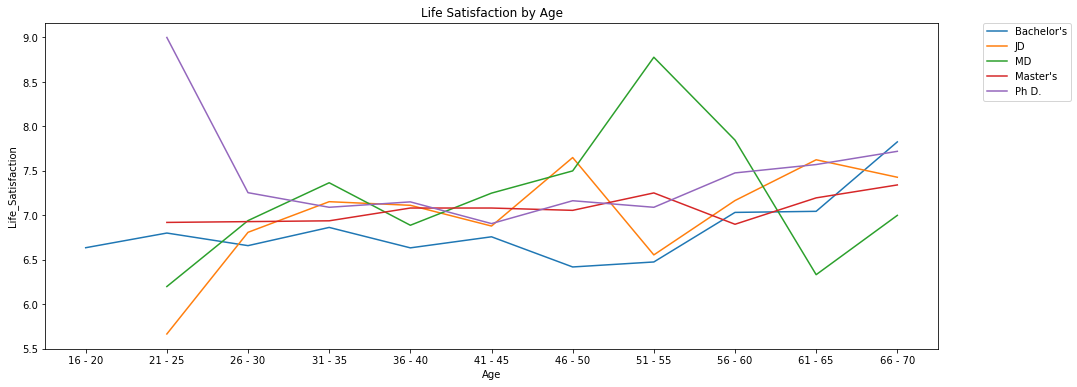

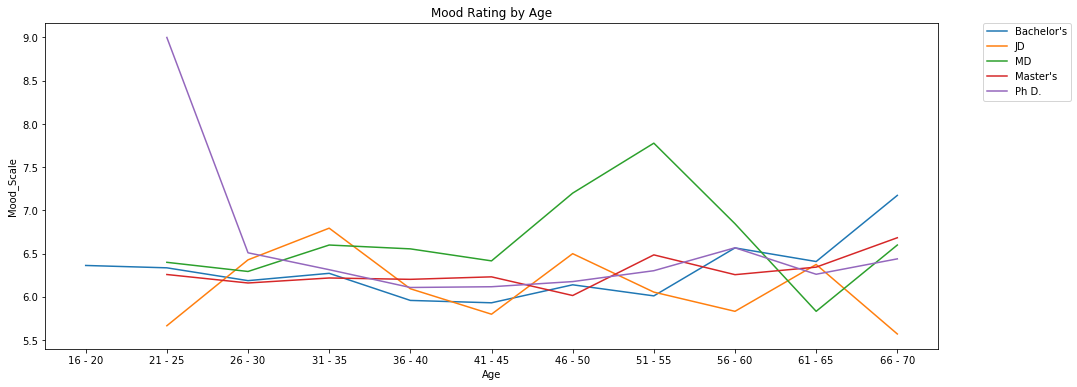
Note: there’s one really happy person with/pursuing a PhD in their early 20s. I’d try to ignore them when looking at the data.
The graphs point towards more education being better when it comes to various measures of life satisfaction. Those with only a bachelor’s do worst in every category, except maybe mood rating. I’d caution that some of these measures have few observations (for instance, there are 9 really satisfied doctors in the 51-55 range that are creating the spike seen in most graphs) but it seems like more education is associated with greater satisfaction throughout your entire life.
Final words
These investigations slightly support the notion people aren’t having a good time in their 20s. Certainly, they’re not romantically satisfied, but if the self-reported measures of life-satisfaction are taken at face value, they are doing the worst compared to older peers.
Writing this also makes me a bit sceptical of the vitriol heaped on higher education in some circles. Graduate education is a trial for many (and I’d be concerned if it wasn’t) though it seems to confer lifelong benefits that appear in different satisfaction measures. The mechanism at play could be increased earning power which translates into greater satisfaction, but I haven’t checked this. Still, if it’s the dollars that matter more than the degree, graduate education remains a legitimate way to chase cash. It’s not the best route, but it’s far from the worst.
-
When I say someone is having a ‘bad time’, I’m referencing their day-to-day mood more than anything. ↩︎
-
To my knowledge, the proportion of LGBTQ folks in the US is thought to be between 2-8%. However, there are estimates which put the LGBTQ population of San Francisco at around 15%. You can decide whether this makes non-heterosexual people under or overrepresented among ACX readers. ↩︎
-
There were some other measures, like anxiety scores, but I arbitrarily decided not to use them. ↩︎